Data visualisation is the new blood of the global economy. We live in an era where enterprises generate plenty of data everyday, but only some of them leverage the full potential of data. Data is not of use until it is processed into insights. While having many data, enterprises are struggling to make sense of the collected data. Here come the data visualization solutions, which help enterprises turn data into stories to get business insights.
what is Data visualisation:
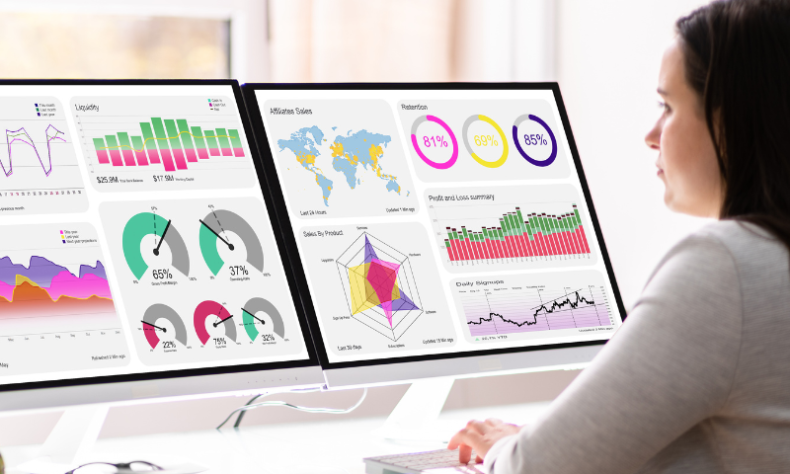
Data visualization, as its name defines it, is the method of converting raw data into visual content such as maps, graphs, and charts. It makes the data easier to understand and draw insights. The primary purpose of the data visualization process is to help people identify trends and patterns in a large set of data. Once the data is collected and processed, it should be visualized in the best form.
“Did You Know?
64% of people during an event made immediate decision after having a thorough presentations of the data. (Source: Piktochart) “
Why is it important?
Humans are visual beings and process than texts. Today’s is highly competitive. Enterprises need to make faster decisions based on the accurate data insights in the competition. We all are trying to make decisions faster based on accurate insights. Data visualization helps in creating data stories with visual graphics. It turns raw data into meaningful information, helping organizations to have a big picture of the data to make the right decision. insights. Data visualization helps in creating data stories with visual graphics. It turns raw data into meaningful information, helping organizations to have a big picture of the data to make the right decision.
Easy To Understand: Visual representations of the collected data are easier to interpret than text or numerical values. It simplifies the data and converts it into various patterns and trends to comprehend the insights of the data.
Helps in Making Insight-driven decisions : Data visualisation makes the interpretation of data easier. Enterprises can quickly identify the patterns, themes, and correlations to make the correct business decision.
Efficient communication: Visualizations are one of the best ways to fill the communication gaps in teams. Having easy-to-understand data helps all team members to understand the insights whether they have a data analysis background or not.
Storytelling: Storytelling keeps the audience engaged and helps them interpret the reports’ real insights. Data visualization tools help create reports in the most engaging formats that convey the narratives and message most effectively.
Quickly identify errors and anomalies: Identifying the errors and anomalies in the data is the most difficult task for the professionals, especially when there is a huge volume of data. Data visualization can help instantly identify inconsistency and errors, helping enterprises find more accurate insights from the data.
“Did you know?
ROI case studies conducted by Nucleus Research explored that analytics and data visualization helps enterprises get an average benefit of $9.01 against every dollar enterprise invested.” – Source
Industry wise Use cases for Data visualisation
Here are some use cases of data visualization:
Retail: Data visualization helps enterprises to make a thorough analysis of the sales data, inventory levels, and customer behavior. It helps them define the best products, pricing strategies, stock levels, and market patterns. Ultimately, they will get the insights to improve customer satisfaction.
Manufacturing: Data visualization helps manufacturing industries’ professionals monitor and track production processes, quality metrics, and other parameters. Interactive dashboards and visual graphics help them to improve operational efficiency.
Marketing and Advertising: Marketing professionals utilize data visualization services to get a clear picture of their market segments, ad performance, customer analysis, and analyzing market demands. Based on the insights and reports, marketing professionals make business decisions and devise marketing strategies.
Transportation and Logistics: Visualizing the data collected from the GPS devices regarding the delivery routes helps the professionals to optimize the routes, improve the logistics process and reduce costs.
Human Resources: HR professionals clearly understand talent management, employee turnover, and employee performance. Visualizing these data helps them to improve employee performance, reduce turnover, improve employee satisfaction, and make data-driven decisions to acquire and retain the best talent.
Healthcare: Data visualization is critical for healthcare professionals as it helps them track and monitor the patients’ critical information. Healthcare professionals can analyze the patients’ well-being, efficiency, customer satisfaction, and expenditure. Visualizing these data helps them understand the situation clearly. Based on these data, healthcare professionals can make decisions quickly.
Finance Data visualisation: While finalizing the decision on buying or selling any asset, professionals need to check the performance of their choices. Usually, professionals use candlestick charts to monitor price changes over time. These charts enable them to analyze various data points to make the right investment decision.
How can we help you?
data visualization is a necessity of the time. Business leaders need to build an insight-driven organization to compete in the market. At Saxon, we have a team of data experts who offer customized data visualization services based on your enterprise requirements. Browse our services to power up your data journey.
We help you to build interactive, scalable, and easy-to-use dashboards quickly and ensure you get the real meaning out of your data with our data visualization services. Do you need help with any specific business use cases for your business? Let’s discuss.